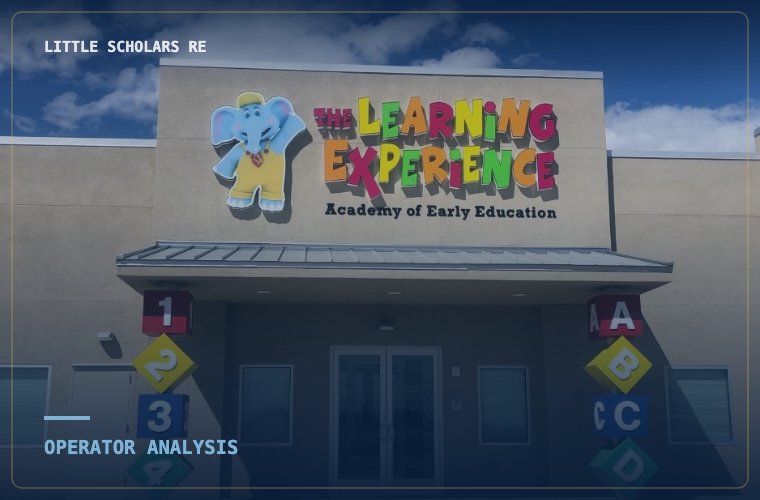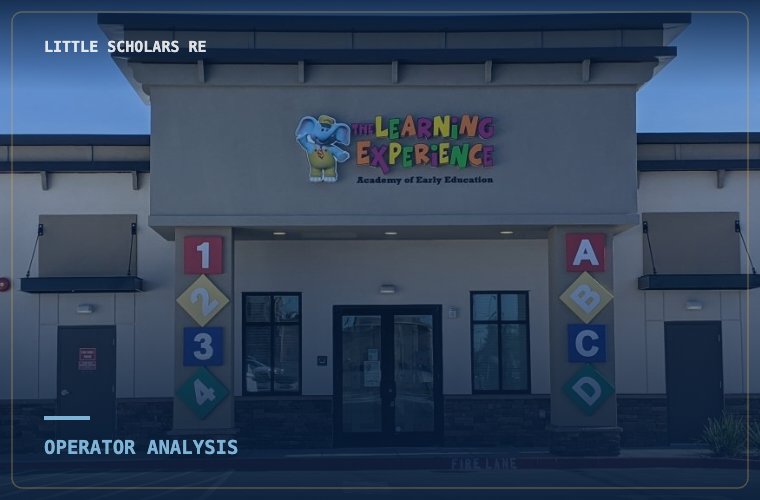
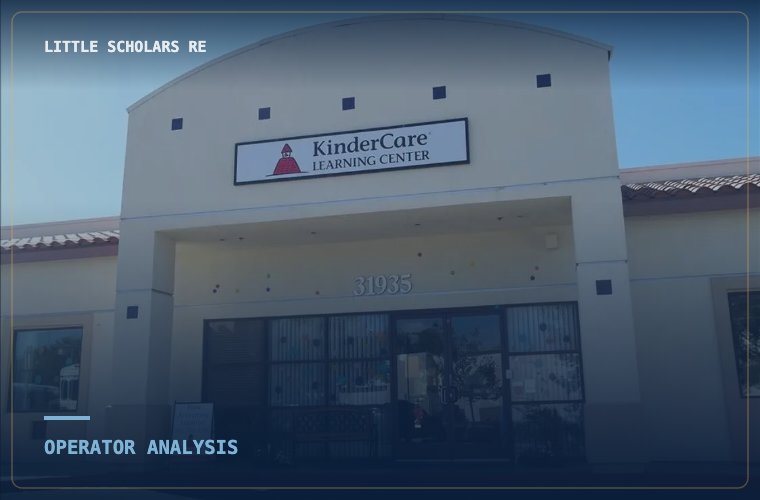
Morgan Stanley's latest note on KinderCare and Bright Horizons makes a point every center owner should hear: more families need care, but that is not turning into more enrolled children. The reasons are price and capacity, and they affect operators and landlords differently.
What Morgan Stanley said
In a note summarized by Finimize on September 23, 2026, Morgan Stanley said demand for U.S. child care is picking up, but the two large public operators are still struggling to convert it into filled seats. The bank estimates that enrollment of 3- and 4-year-olds over 2020–2024 remains about 3% below pre-COVID levels.
It points to two constraints. The first is price: average annual center-based tuition of roughly $13,000 for a 4-year-old and $15,000 for an infant, with household childcare spending rising faster than wages since the start of 2025. The second is capacity: a supply-demand gap of roughly 30%, meaning many markets lack enough licensed slots at prices families can pay.
Morgan Stanley does not expect either pressure to ease much without meaningful government support. It kept underweight ratings on both companies and trimmed its price targets, to $2 from $2.50 for KinderCare and to $66 from $68 for Bright Horizons.
Both stocks were already under pressure. KinderCare traded at $2.31 when the note came out, so the new target sits about 14% below that price; the average analyst target is $4.06. Bright Horizons opened that day at $64.91, well below its 52-week high of $110.14.
What the operators reported for the second quarter
KinderCare. Same-center occupancy was 68.6%, down 2.4 points from a year earlier, and total enrollment fell 4%. Revenue was essentially flat at $698 million, while adjusted EBITDA fell to $63 million from $82.4 million. The company closed 49 centers in the quarter, about 3% of its footprint, and expects 80 to 85 closures by year-end. The closed centers averaged under 37% occupancy. Management expects the program to lift portfolio occupancy by roughly 150 basis points, with some lease-exit costs running into 2027. Part of the guidance cut came from state subsidy reimbursement rates rising more slowly than expected.
Bright Horizons. Full-service occupancy averaged in the high 60s, about 70% excluding Australia, and enrollment at centers open more than a year rose about 1% on the same basis. Full-service revenue grew 3% to $557 million, helped by tuition increases. The share of centers below 40% occupancy fell from 10% to 5% year over year, partly because underperformers were closed. The company opened seven centers and closed seven leased centers, ending at 988, and expects occupancy to dip to the mid-60s in the third quarter.
Both companies are raising prices and closing their weakest centers to hold occupancy up. We covered the filings in more detail in what the public operators' filings reveal and our Q2 2026 operator update.
A center's costs are mostly fixed. Rent, ratio-driven staffing, and licensing overhead stay roughly the same whether a classroom is full or half empty. When families cannot afford a seat or cannot find one nearby, revenue falls faster than costs, and margins suffer. That is why Morgan Stanley's KinderCare target is effectively a call on occupancy.
What government support looks like in 2026
Morgan Stanley's condition for improvement is meaningful public funding. The direct subsidy channel grew only slightly this year. Final FY2026 appropriations, signed February 3, raised the Child Care and Development Block Grant by $85 million to $8.831 billion, about 1%. Advocates note that falls short of inflation, and at current funding the program reaches about 17% of eligible children age five and under.
The larger 2026 change runs through employers. The One Big Beautiful Bill Act raised the Section 45F employer childcare credit from 25% to 40% of qualified costs (50% for small businesses) and lifted the annual cap from $150,000 to $500,000 ($600,000 for small businesses). It also raised the dependent care FSA limit from $5,000 to $7,500, the first meaningful increase since 1987. Those changes favor employer-sponsored care, which is the core of Bright Horizons' model and a growing line at KinderCare. For owners, that makes nearby large employers a real part of the demand picture.
Why a building owner reads this differently
For the operating company, a 30% supply gap alongside falling enrollment is a pricing problem. For the real estate, the same gap is a scarcity argument. Licensed, well-located capacity is hard to add, and the shortage Morgan Stanley describes is the reason existing buildings in underserved markets hold their value.
We saw the two assets priced separately earlier this month. Three weeks after KinderCare's stock fell roughly by half, lenders refinanced 549 of the buildings under its centers for $650 million on about 2.0 times debt service coverage. We covered that deal in the $650M refinancing.
The affordability ceiling still matters to a landlord, because it limits how much rent a center can carry. Buyers test that directly: rent under about 12% of gross revenue is comfortable, 12% to 15% draws scrutiny of the enrollment trend, and above 15% most buyers re-cut the offer or ask for a lease restructure.
Which buildings come to market
The closure programs tell landlords where the risk sits. KinderCare is exiting centers that averaged under 37% occupancy, while naming childcare deserts and high-demand markets such as Bentonville, Arkansas and Irvine, California as where it wants to grow. Bright Horizons is doing the same thing on a smaller scale. Expect more second-generation buildings to come back to their owners through lease exits and restructures over the next year, mostly in markets that already had too many seats.
If your tenant is a national operator, the questions to ask are the ones the operators ask themselves: how occupied is the center, how does it rank within the operator's local portfolio, and how much of the lease term is left.
What this means if you own or are selling a center
Buyers are underwriting occupancy, not demand. A waitlist helps, but enrollment history, staffing that supports full classrooms, and rent coverage are what move the price. Document all three before you go to market.
The market is also splitting by product type. Across our tracked comp set, rent on centers built within three years of sale reached $39.57 per square foot in 2026, an all-time high, while second-generation space fell to $21.91. Newer, purpose-built centers in undersupplied markets are what institutional buyers and lenders are paying for.
Find out what your school is worth.
A confidential, no-pressure valuation from a broker who has owned, operated, and sold childcare centers for nearly 40 years.

Alan Stahl
Founder & CEO of Little Scholars Real Estate. Alan has owned, operated, and brokered childcare centers for nearly 40 years, with 80 transactions closed across 18+ states. Meet Alan and the team →