
KinderCare and Bright Horizons publish what private operators never do. Their 2026 filings show occupancy falling, price covering the gap, and the center-based business earning far less than most owners assume.
Almost everything published about childcare occupancy is an estimate. Operators guard the number, brokers repeat rules of thumb, and buyers end up underwriting on whatever the seller says. But two companies in this industry are required by law to tell the truth about it every ninety days — and their 2026 filings are the most useful benchmark an owner or landlord can get.
Occupancy: 66%, and falling
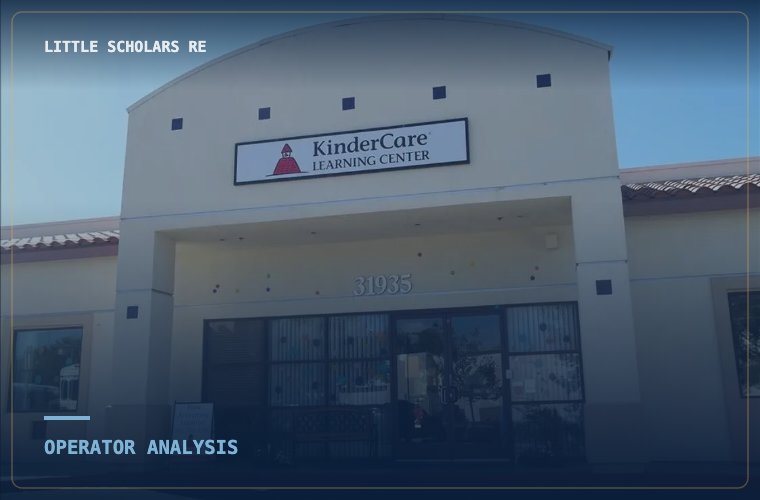
KinderCare Learning Companies operates 1,606 early childhood education centers with licensed capacity for roughly 215,000 children. It is the largest private provider in the country. For the quarter ended April 4, 2026, it reported same-center occupancy of 66.0% — down 310 basis points from 69.1% a year earlier. For full fiscal 2025 the figure was 67.8%, itself down from 69.8% the year before.
| Quarter | Same-center occupancy |
|---|---|
| 1Q25 | 69.1% |
| 2Q25 | 71.0% |
| 3Q25 | 67.0% |
| 4Q25 | 64.5% |
| 1Q26 | 66.0% |
KinderCare same-center occupancy by quarter. Source: KinderCare Learning Companies first-quarter 2026 supplemental earnings materials.
Read that trend carefully. This is not a company in distress selling to a struggling demographic — it is the scaled national operator, with the marketing budget and the brand recognition, running its mature centers one-third empty. If a seller tells you 85% is the industry norm, the largest operator in America has not seen 85% in years.
Price is covering for enrollment
KinderCare's own fiscal 2026 guidance lays out where revenue growth is expected to come from, and it is unusually candid. Occupancy is projected to subtract about 3% from revenue growth. Tuition is projected to add about 3%. The two cancel, and the rest of the growth comes from before- and after-school programs, new center openings, and tuck-in acquisitions, less about 1% from closures.
That is the entire industry in one line: the largest operator is holding revenue flat by raising prices into falling enrollment. It works — until it doesn't. Every year of 3% tuition increases against declining occupancy narrows the band of families who can still afford the seat, and the operators most exposed are the ones with the least pricing headroom in their trade area.
For an owner, the question this raises is specific and answerable: how much of your revenue growth over the last three years came from rate, and how much from enrollment? A buyer's analyst will separate those two, and a center whose growth is entirely rate-driven gets underwritten differently than one adding children.
Rent runs about 10.5% of revenue — the coverage test that matters
KinderCare leases nearly all of its 1,600-plus centers. Its filings disclose total lease obligations of $2.4 billion including imputed interest, with $285.8 million payable in fiscal 2026, against fiscal 2025 revenue of $2,733.3 million. That puts rent at roughly 10.5% of revenue.
That number is the most practically useful thing in the entire filing. It gives you a benchmark for the single most important question in childcare net-lease underwriting: can the tenant actually pay this rent? If a center's rent comfortably exceeds 11% or 12% of its revenue, that tenant is carrying a heavier load than the largest, best-capitalized operator in the country — and it is carrying it without KinderCare's scale, purchasing power, or balance sheet.
Two related disclosures give the picture depth. The weighted average remaining term on KinderCare's operating leases is 9 years, and roughly 500 of its centers sit under a single master lease whose initial term runs to 2033. That is the shape of institutional childcare real estate: long-dated, corporate-guaranteed, and concentrated.
More than a third of the revenue is government money
KinderCare disclosed that $1,001.4 million of its fiscal 2025 revenue — 36.6% of the total — came from families whose tuition is partially or fully subsidized by government agencies. That share has grown for three straight years.
For a landlord, this reframes what tenant risk means. You are not only underwriting an operator's management and enrollment; you are underwriting the durability of state and federal childcare subsidy programs across the life of a ten-year lease. That is not a reason to avoid the asset class — subsidy funding has grown steadily under both parties for two decades — but it is a question worth asking of any childcare tenant before signing: what share of your revenue depends on subsidy, and which programs?
The Bright Horizons number nobody expects
Bright Horizons breaks its business into three segments, and the margins are startling:
| Segment | FY2025 revenue | Adj. operating income | Margin |
|---|---|---|---|
| Full-service centers | $2,081M | $114M | 5.5% |
| Back-up care | $728M | $222M | 30.5% |
| Educational advisory | $125M | $27M | 21.6% |
Source: Bright Horizons Family Solutions investor presentation, May 2026. Margin is our calculation.
The center-based childcare business — the part that occupies real estate, employs teachers, and enrolls children — earns a 5.5% operating margin. Back-up care, an asset-light service with no centers attached, earns 30.5% and contributes over 60% of the company's operating income on roughly a quarter of its revenue.
That is worth sitting with. The most sophisticated employer-sponsored childcare company in the world runs its physical centers at a mid-single-digit margin and makes its money somewhere else entirely. It also tells you why these operators lease rather than own: at 5.5% margins, capital tied up in buildings is capital not earning its keep.
For a landlord, it explains the whole structure of the asset class — why sale-leasebacks are common, why corporate guarantees matter more than building quality, and why rent coverage is the number to check first.
The definition trap: "enrolled" is not "occupancy"
One methodological point, and it is worth real money in a negotiation.
The centers in our 2025 survey report a median utilization of 77.2% — enrollment divided by licensed capacity. KinderCare reports 67.8%. The gap does not mean surveyed centers outperform. KinderCare divides full-time-equivalent enrollment by capacity. When a school reports how many children are enrolled, it typically counts each child once, part-timers included.
A 100-seat center with 85 enrolled children, 20 of whom attend three days a week, honestly reports 85% enrollment — and runs at roughly 77% on a full-time-equivalent basis. Both numbers are true. Only one of them predicts revenue, because earnings follow attendance days, not names on a roster.
So when a seller quotes occupancy, ask which one they mean. Ask for the full-time versus part-time split. At a 150-seat center, the difference between 92% enrolled and 77% FTE is about 22 seats of revenue — and at a 3× multiple, that gap is most of the negotiating range.
What to do with this
If you own a center: know your FTE occupancy, not just your roster count, and know how much of your recent growth came from rate versus enrollment. Both will be asked.
If you own the building: run the rent-coverage test. Rent above roughly 11% to 12% of center revenue deserves scrutiny, whoever the tenant is.
If you are buying: 66% is the benchmark occupancy for a mature, professionally managed center in 2026. A center at 80% FTE is genuinely outperforming. A center at 60% is not a bargain — it is the market.
Want the underlying numbers? Our Licensed Supply Index counts every licensed center in six major metros, and the Childcare Cap Rate Index tracks ten years of actual sold cap rates. Both are free to download and cite.